Fitxer:Heat eqn.gif
De testwiki
Salta a la navegació
Salta a la cerca
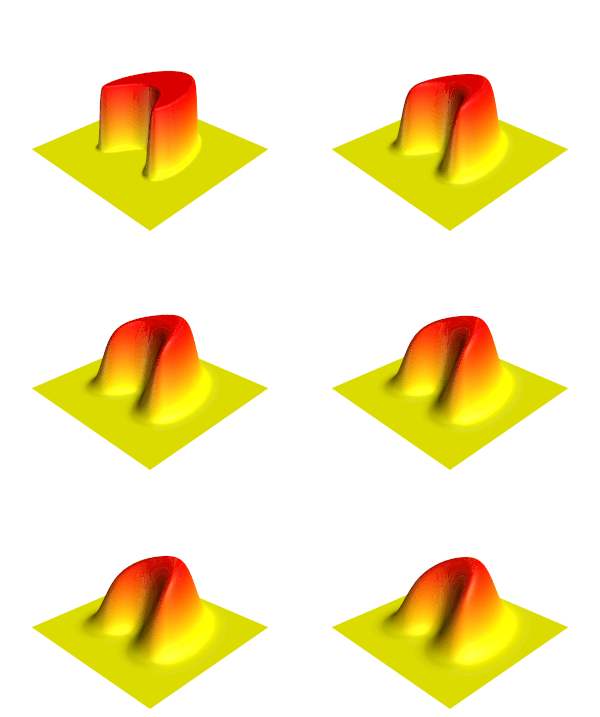
Heat_eqn.gif (200 × 136 píxels, mida del fitxer: 500 Ko, tipus MIME: image/gif, en bucle, 181 fotogrames, 6,0 s)
Aquest fitxer prové de Wikimedia Commons i pot ser usat per altres projectes. La descripció de la seva pàgina de descripció es mostra a continuació.
Resum
| DescripcióHeat eqn.gif |
English: Illustration of the Heat equation. Русский: Решение уравнения теплопроводности. |
| Data | (UTC) |
| Font |
Treball propi Aquesta GIF imatge rasteritzada ha estat creada amb MATLAB. |
| Autor | Oleg Alexandrov |
| Altres versions |
 |
Llicència
| Public domainPublic domainfalsefalse |
| Jo, el titular del copyright d'aquesta obra, l'allibero al domini públic. Això s'aplica a tot el món. En alguns països això pot no ser legalment possible, en tal cas: Jo faig concessió a tothom del dret d'usar aquesta obra per a qualsevol propòsit, sense cap condició llevat d'aquelles requerides per la llei. |
MATLAB source code
% illustration of the heat equation
% Solve the heat equation using finite differences and Forward Euler
function main()

   % the number of data points. More points means prettier picture.
   N = 400;

   L = 2.5; % the box size is [-L, L] x [-L, L]

   XX = linspace(-L, L, N);
   YY = linspace(-L, L, N);
   [X, Y] = meshgrid(XX, YY);

   scale = 2;
   Z = get_step_function (N, scale, X, Y);

   CFL = 0.125; % CourantFriedrichsLewy
   dx = XX(2)-XX(1);  dy = dx; % space grid
   dt = CFL*dx^2;

   plot_dt = 0.004; % plot every plot_dt iterations

   cmap = rv_matrix_rows(autumn); % colormap

   % Solve the heat equation with zero boundary conditions
   T = 0:dt:1;
   iter = 0;
   frame_no = 0;
   for t=T

      % plot the current temperature distribution
      if floor(t/plot_dt) + 1 > frame_no

         frame_no = frame_no + 1

        % plot the surface
         figure(2); clf;
         surf(X, Y, Z);

         %  make the surface beautiful
         shading interp; colormap(cmap);

         % add in a source of light
         camlight (-50, 54);
         lighting phong;

         % viewing angle
         view(-40, 38);

         axis equal; axis off;
         axis([-L, L, -L, L, 0, scale])

         hold on; plot3(0, 0, 3.4, 'g*'); % a marker to help with cropping

         pause(0.1);
         %return

         file = sprintf('Movie_frame%d.png', 1000+frame_no);
         %saveas(gcf, file) %save the current frame
         print(gcf, '-dpng', '-r400', file) %save the current frame

         disp(file); %show the frame number we are at

         % cut at max_fr_no frames
         max_fr_no = 15;
         if frame_no >= max_fr_no
            break
         end

      end

      % advance in time
      W = 0*Z;
      for i=2:(N-1)
         for j=2:(N-1)

            W(i, j) = Z(i, j) + dt * ( Z(i+1, j) + Z(i-1, j) + Z(i, j-1) + Z(i, j+1) - 4*Z(i, j))/dx^2;

         end
      end
      Z = W;

   end


% The gif image was creating with the command
% convert -antialias -loop 10000  -delay 20 -compress LZW Movie_frame10* Heat_eqn.gif

% get a function which is 1 on a set, and 0 outside of it
function Z = get_step_function(N, scale, X, Y)

   c = 2;
   d=-1;
   e=1;
   f=0.5;
   k=1.2;
   shift=10;

   Z = (c^2-(X/e-d).^2-(Y/f).^2).^2 + k*(c+d-X/e).^3-shift;

   Z = 1-max(sign(Z), 0);
   Z = scale*Z;

function X = rv_matrix_rows(X)

   [m, n] = size(XL);

   for i = 1:m
      j = m + 1 - i;
      if i < j
         tmp = X(i, :); X(i, :) = X(j, :); X(j, :) = tmp;
      end
   end
Llegendes
Afegeix una explicació d'una línia del que representa aquest fitxer
Animación de la ecuación del calor.
Elements representats en aquest fitxer
representa l'entitat
Algun valor sense element de Wikidata
23 nov 2007
image/gif
Historial del fitxer
Cliqueu una data/hora per veure el fitxer tal com era aleshores.
| Data/hora | Miniatura | Dimensions | Usuari/a | Comentari | |
|---|---|---|---|---|---|
| actual | 19:01, 2 feb 2024 |  | 200 × 136 (500 Ko) | wikimediacommons>Jahobr | more frames (by user Emil Dalalyan) |
Ús del fitxer
Les 2 pàgines següents utilitzen aquest fitxer:
